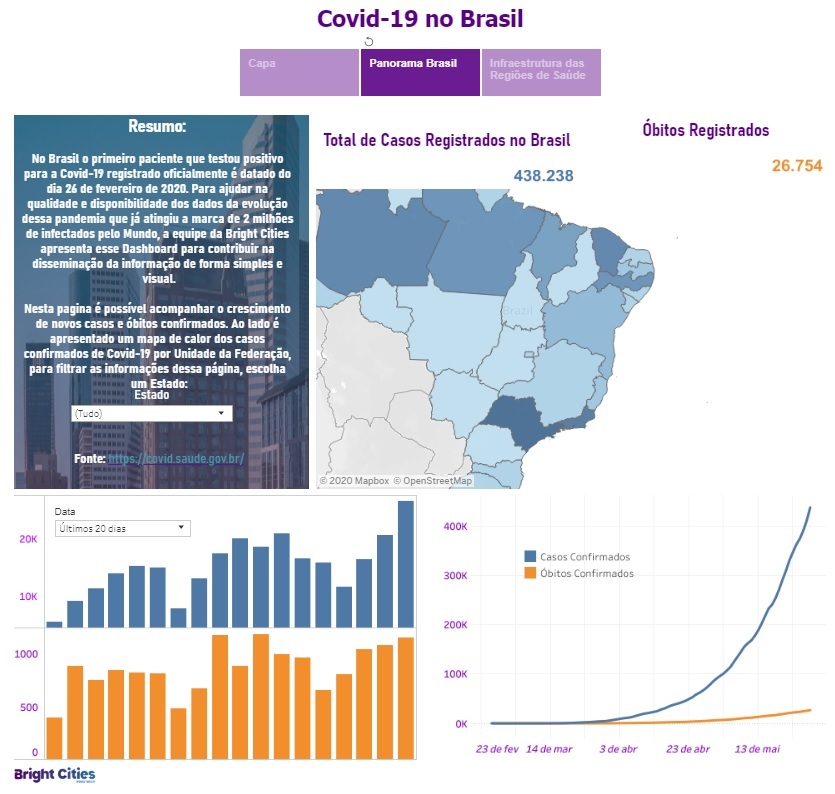
Online and free, the tool presents the main information about the disease in a consolidated way
In the country’s largest cities, the coming weeks may represent the first steps towards relaxing social isolation. With capitals like São Paulo and Recife announcing their first plans for the gradual opening of shops and services, attention is turned even more to daily reports and newsletters, crucial to understanding whether the new measures will guarantee – or not – the safety of residents.
Bright Cities believes that creating public policies based on data collection and analysis is the most efficient and safest way to contribute to the quality of life of the population. That is why we used all of our data analysis expertise to launch another support tool for cities during this pandemic. Available online and free of charge for citizens and public managers, the Dashboard Bright Cities Covid-19 gathers the main information about the coronavirus in the country and wants to contribute to the strategic planning of urban policies.

⠀⠀⠀⠀⠀⠀⠀⠀
For this, the tool combines data collected from a series of official sources, captured in real time and updated daily, and consolidates them in a single platform with practical and intuitive interface, made with Tableau Software technology. Among the available indicators are the number of confirmed cases and deaths, the number of available respirators, the number of ICU beds in the public / private system and the amount of hospitals. Unlike many of the interactive panels already published, the Dashboard Bright Cities Covid-19 was developed in an unprecedented format that allows data verification by municipality, thus facilitating the access of public managers, as well as by Health Regions, a division adopted by the Brazilian Ministry of Health. Among its advantages are:
- Consolidated information about the main indicators to understand COVID-19: the tool provides, in one place, several indicators for a complete analysis on the progress of the disease and the effectiveness of the measures adopted;
- Multiple data sources in one single dashboard: the data are obtained only from official and secure sources, such as the Health Surveillance Secretariat (SVS / MS) and the DATASUS portal;
- Real-time data collection and daily update: the agility allows for always up-to-date analysis of the city;
- Rapid detection of trends to answer the most complex questions: with reliable and constantly updated sources, the dashboard allows you to have precise conclusions about the pandemic.

⠀⠀⠀⠀⠀⠀⠀⠀
In addition, the tool allows the future inclusion of other indicators that are relevant for monitoring public management and that involve areas such as education, economics, innovation and the environment. This is because, as a diagnostic platform for smart cities, Bright Cities uses 160 indicators recognized by international entities such as the UN (United Nations) and ISO (International Organization for Standardization) to diagnose regional contexts and identify the main social and economic challenges of a municipality.
In this way, the information can reach far beyond the health area. With the impacts of the pandemic on the city as a whole, the importance of monitoring and creating social actions that meet the needs of the population in a more assertive and efficient manner is even bigger. This includes psychological support services, mapping the population at greatest risk and social assistance programs, among others.
The Dashboard Bright Cities Covid-19 is able to gather information to identify the deficiencies and needs faced by the population of a given city during the pandemic. One of the areas analyzed, for example, is education: based on official data, the tool has access to the number of people with access to the internet and the computer, for example, and thus is able to determine whether students in most vulnerable situation are able to attend online classes.
Gathering fundamental data so that managers can develop alternatives to urban problems, the analysis made by Bright Cities also indicates the possible paths to be adopted so they can be reached. For this, we use our database of intelligent solutions, the biggest in the world, and select among the more than one thousand registered initiatives those most relevant to face the pandemic in the evaluated indicators.
The city of Aracaju / SE, one of the Brazilian cities to adopt the Bright Cities platform, received an exclusive dashboard with social action indicators to serve the city’s most vulnerable population. The city of Juazeiro do Norte / CE also adopted the Bright Cities dashboard to monitor coronavirus cases in its territory and to map hospitals that have ICU beds.
The dashboard can be customized for any municipality and is a service available for clients of standard and premium plans. The municipality also gains access to the complete diagnosis + roadmap carried out by Bright Cities platform . Find out here how our methodology works and how to make your city a smart city!


